Overview
At the core of WetlandSense is a rigorous, peer-reviewed method for identifying where wetlands are likely present, using public data and physically informed AI. Our results support more informed decision-making by disambiguating the landscape.
The WetlandSense data products are intended to act as an initial screening for wetland presence, not a replacement for field surveying or jurisdictionally confirmed delineations.
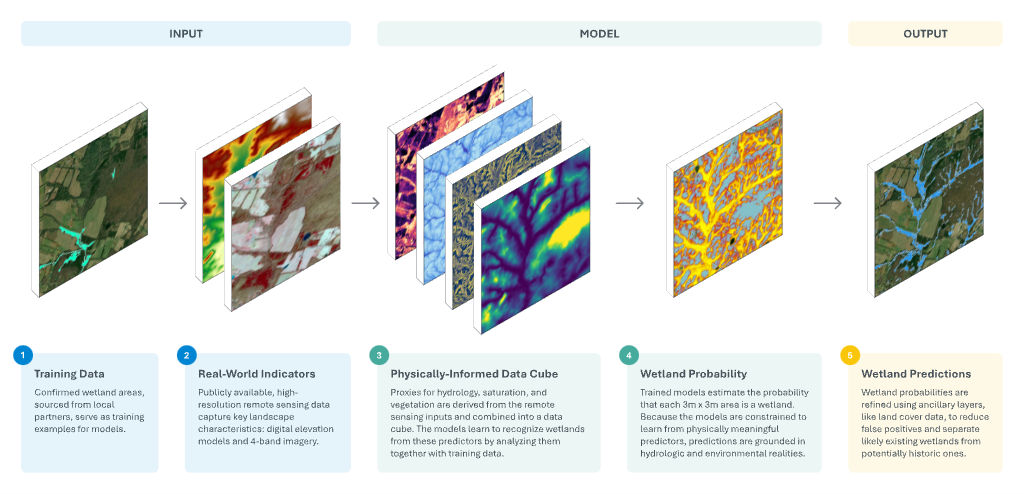
Figure to be replaced with a cleaner, higher-resolution overview graphic.
WetlandSense Data Products
Three core modeled layers describe wetland probability and the polygon layers derived from it. Product names match the map layer toggles in Modeled Wetland Layers.
Existing Wetlands
What it is
Areas where the model identifies time-averaged wetland conditions and ancillary data further supports that wetlands exist today. These polygons represent areas with 0.5 or greater wetland probability that are additionally corroborated by ancillary layers indicative of wetland presence.
How to interpret it
This dataset estimates the areal extents of functional, existing wetlands. These estimates are substantiated by two sources of evidence: 1) Presence of time-averaged hydrologic and geomorphologic wetland signatures, and 2) Spatial agreement with ancillary layers. The ancillary layers are indicative of wetland presence, but too coarse to be used as model inputs directly (e.g., land use land cover or soils data).
Example use cases
- Estimate total wetland area across candidate sites to inform least-impact decisions.
- Baseline input data for calculations of wetland ecosystem services.
Potentially Historic Wetlands
What it is
Areas where the model identifies time-averaged wetland conditions, but ancillary data suggests wetland function may have been altered or inhibited by land-use change. This is the complement to Existing Wetlands, isolating wetland probabilities of 0.5 or greater where ancillary information suggests a wetland could not naturally function today.
How to interpret it
This dataset delineates areas where the terrain would support a wetland but also show evidence that wetland functions are inhibited by current land use or land cover. These estimates are substantiated by two sources of evidence: 1) Presence of time-averaged hydrologic and geomorphologic wetland signatures, and 2) Spatial agreement with ancillary layers that indicate wetland functions could not naturally occur due to a lack of favorable soil or land cover presence.
Example use cases
- Identify areas where wetlands previously existed but have since been converted.
- Screen candidate areas for conservation or hydrologic investigation together with land ownership and land use information.
- Prioritize field review where modeled hydrology and altered land cover overlap.
Wetland Probability Raster
What it is
The direct model output showing the probability of time-averaged wetland conditions. Each pixel value represents the modeled probability that wetland characteristics are present. This is the direct inference output from the physically-informed AI model. The model relies primarily on topographically-based proxies — soil saturation and slowed runoff — for wetland prediction, and secondarily considers vegetation presence. This dataset is prescreened to remove areas with a probability of less than 0.25 and data within impervious or open water areas. This dataset is the basis for the polygon layers and establishes a minimum wetland mapping unit of 9 square meters.
How to interpret it
This dataset conveys how model confidence varies within and surrounding the polygon layers (Existing Wetlands and Potentially Historic Wetlands). Values closer to 1 indicate higher model confidence that geomorphologic and hydrologic characteristics suggest wetland presence. Areas of moderate probability may indicate transitional or seasonally fluctuating areas, or model uncertainty.
Example use cases
- Apply a custom threshold to assert wetland areas based on individual tolerance for over or under representation.
- Prioritize field surveying based on the gradient of wetland probability.
- Extend analysis beyond the polygon layers for custom conservation or planning workflows.
WetlandSense Methodology
WetlandSense maps wetland footprints with physically-informed AI, capturing hydrologic and geomorphologic information that standard AI approaches routinely miss. At a high level, we build deep learning models that learn from a multiband “image” that is purpose built for wetland mapping. Rather than feeding models raw imagery or elevation data, WetlandSense leverages physically meaningful, high-resolution indices (i.e., predictor variables) that encode decades of hydrologic science and establish domain knowledge for the model upfront.
The WetlandSense methodology is an evolution of initial research carried out at the University of Virginia (O’Neil et al., 2018; 2019; 2020), of which components have been automated as Arc Hydro tools. Additionally, this approach has been informed and improved by the larger body of peer reviewed literature on wetland mapping, hydrologic feature extraction, and geospatial AI.
Physically Informed Deep Learning
Deep learning models learn to recognize patterns from an input image, ultimately learning what target features “look like” in terms of individual values of the input image and how those values are arranged in space. Standard deep learning applications for geospatial feature detection rely on raw remote sensing datasets, like multispectral imagery and elevation. Wetland detection is a uniquely challenging task following this approach – they can be hidden under tree canopy and are transitional landscapes marked by subtle visual and topographic cues. WetlandSense addresses these challenges by effectively biasing deep learning models to learn from images embedded with physically meaningful wetland drivers. Rather than allow models to build relationships between topography and imagery from scratch, WetlandSense models start off with curated information on flow convergence, saturation, and vegetation.
The WetlandSense models learn how to predict wetland presence by analyzing input images, comprised of four predictor variables, and reference wetland polygons (i.e., training data). Trained models retain the set of relationships and dependencies between input images and wetland presence. These trained models are deployed outside of training areas to evaluate its learnings and predict likely wetland locations (i.e., inference). The resulting wetland predictions are representative of the same combination and arrangement of input image values that the model has learned corresponds to wetland presence, according to the training data.
Model Inputs
Input Image
WetlandSense leverages high-resolution, publicly available remote sensing data — including digital elevation models (DEMs) — to build input model images. Model images contain four bands, one for each predictor variable: Topographic Wetness Index (TWI), Curvature, Cartographic Depth-to-Water Index (DTW), and Normalized Difference Vegetation Index (NDVI). All predictor variables are calculated at a 3-meter resolution. The three topographically based variables (TWI, Curvature, and DTW) are derived from high-resolution DEMs that have been smoothed to optimize hydrologic feature extraction.
Training Data
Model Outputs
Probabilities
The model inference process produces a probability for each pixel where the model is applied and where the same set of model inputs (TWI, curvature, DTW, and NDVI) are prepared. These probabilities are the modeled likelihood that an individual pixel belongs to the predicted “wetland” class. These probabilities are considered a raw model output and are post-processed to ultimately create the three core WetlandSense map products (Existing Wetlands, Potentially Historic Wetlands, and the Wetland Probability Raster).
Accuracy
The balance of wetland versus nonwetland area within a landscape can vary significantly – from dense wetland coverage in the Everglades to anomalous presence in the high plains of the Mountain West. For that reason, WetlandSense avoids accuracy metrics that can be skewed by imbalanced prevalence of either wetland or nonwetland coverage. Instead, accuracy is measured by Recall and Precision for the wetland class.
Recall – also known as producer’s accuracy, measures how much of the true wetland area was captured by the wetland predictions. It is calculated as: (Area of correct wetland predictions) / (Area of all actual wetlands)
Precision – also known as user’s accuracy, measures how much of the predicted wetland area is correct. It is calculated as: (Area of correct wetland predictions) / (Area of all wetland predictions made)
Ideally, both metrics can be evaluated and presented together. However, Recall poses the challenge of requiring the true, exhaustive extent of wetland coverage in the evaluation area. Precision, by contrast, requires more specific determinations of true wetland presence. At present, WetlandSense evaluates model accuracy in terms of wetland precision.
Precision is calculated by:
- Defining an area with reasonable validation data on wetland presence
- Scattering 100 randomly placed points within the Existing Wetlands layer
- Tallying the frequency of agreement between modeled wetland presence (determining whether each point within an Existing Wetlands polygon also falls within a wetland boundary as defined by the validation data)
- Calculating wetland precision from these tallies
Accuracy assessment figure not yet published.
This process was carried out using the extents of a 2023 NWI Update, part of the Virginia Chesapeake Extension. The accuracy assessment assumes the wetland extents mapped by the NWI Update are correct, but it does not assume that wetlands are exhaustively mapped throughout the entire project area.
Limitations and Caveats
Robustness of the accuracy assessment
WetlandSense aims to fill the need for more accurate data on wetland presence and coverage. Because that need exists, robust accuracy assessments can be challenging. Detailed and accurate wetland delineations, in analysis-ready formats, are rare. Those that are available are prioritized for model training, which inherently precludes them from being used for accuracy assessments. With limited additional wetland delineation data, WetlandSense leverages best available reference wetlands data to estimate model performance. Further, validation data for the Potentially Historic Wetlands layer is unavailable, rendering us unable to provide performance metrics for that dataset. While it is imperfect, the accuracy assessment presented is objective and transparent.
Training data bias
WetlandSense training data is typically sourced from submitted wetland delineations required prior to land development. This creates the possibility for bias in the types of wetlands that WetlandSense models learn the most from considering there are consistent location, landscape, and land use factors related to candidate sites requiring wetland delineations.
Additional Resources
Resources to learn more about the development of the WetlandSense wetland modeling workflow:
- O'Neil, G. L., Goodall, J. L., Behl, M., & Saby, L. (2020). Deep learning using physically-informed input data for wetland identification. Environmental modelling & software, 126, 104665.
- O'Neil, G. L., Saby, L., Band, L. E., & Goodall, J. L. (2019). Effects of LiDAR DEM smoothing and conditioning techniques on a topography‐based wetland identification model. Water Resources Research, 55(5), 4343-4363.
- O'Neil, G. L., Goodall, J. L., & Watson, L. T. (2018). Evaluating the potential for site-specific modification of LiDAR DEM derivatives to improve environmental planning-scale wetland identification using Random Forest classification. Journal of hydrology, 559, 192-208.
Resources to learn more about the implementation of earlier iterations as Arc Hydro tools: